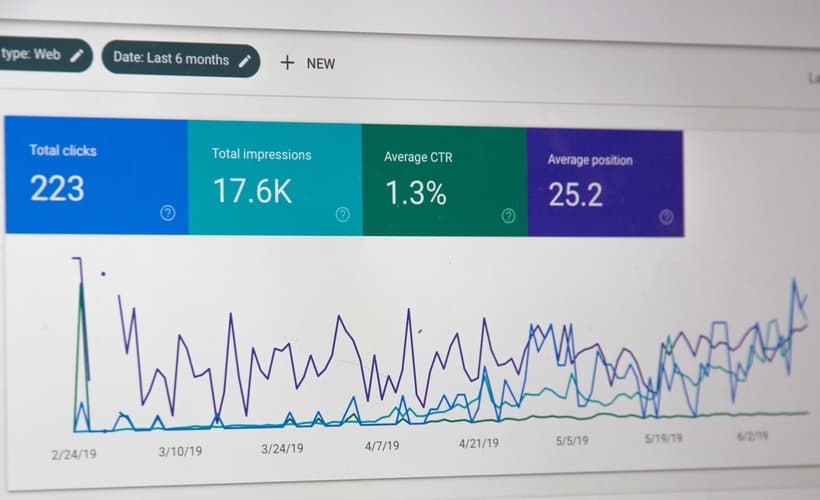
Like any other part of running a business, there are a lot of numbers that can tell you whether your website is helping you reach your goals or not.
Understanding what some key metrics mean, as well as whether they fall in line with normal performance for your industry, can help you identify what you are doing well and what you need to improve. There’s more to track than just the number of visitors!
Bounce Rate
One of the most important metrics to look at is your website’s bounce rate. The bounce rate refers to the number of people who click on your site, but then click away after only a few seconds.
Quite often, audiences will “bounce” away from a site because they clicked on it during a Google search, only to find that its content didn’t match what they were looking for. While some level of “bounce” is inevitable, a high bounce rate could hurt your SEO ranking, making it harder for it to appear in search results.
A research report from Branton found that internet-wide, the average bounce rate is a little over 58 percent, with B2B brands typically having a higher bounce rate than B2C companies. A bounce rate between 30 to 70 percent is normal. Any higher, and you have a problem. Your site might be showing up in irrelevant Google searches, or it might just be boring and unattractive.
Average Time on Page
Somewhat related to your bounce rate is the average time users spend on your page. This metric is tied in with the average page views per session and session duration. These measure how much total time someone spends on your website, as well as how much time they spend on each page.
The more page views and the longer average time spent on your pages, the better. This means viewers are more interested in your content, and actively learning more about your business. These numbers are often good indicators that your website is helping drive sales for your company.
Creating informative, high-value content and presenting it in an attractive layout will encourage site visitors to spend more time there so they can learn about your business.
Cart Abandonment Rate
If you sell products directly on your site, you might be discouraged to see a high number of people who begin but fail to finish the checkout process. However, the Baymard Institute calculates the average online cart abandonment rate at 69.8 percent. Exact rates can also vary by industry.
While you shouldn’t be surprised to see abandonment rates near this level, this is still often a sign you can make improvements. Extra costs and a complicated checkout process are just a few things that can increase your cart abandonment rate.
Look for ways you can streamline your site’s checkout process, and you’ll be able to complete more sales.
Start Tracking!
Tracking these website-related metrics may feel like it is adding to your workload. However, you must remember that your website needs to be much more than just a static “brochure” for your business.
As you track these and other vital metrics, you will be able to adapt your website as needed to better appeal to your target audience. By aligning your website with your digital marketing campaigns and providing an attractive, engaging site, you can improve customer interactions and drive more sales.


